CSOUND
INTENSITIES
Real World Intensities and Amplitudes
There are many ways to describe a sound physically. One of the most common is the sound intensity level (SIL). It describes the amount of power on a certain surface, so its unit is Watts per square meter (). The range of human hearing is about
at the threshold of hearing to
at the threshold of pain. For ordering this immense range, and to facilitate the measurement of one sound intensity based upon its ratio with another, a logarithmic scale is used. The unit Bel describes the relation of one intensity I to a reference intensity I0 as follows:
Sound Intensity Level in Bel
If, for example, the ratio is 10, this is 1 Bel. If the ratio is 100, this is 2 Bel.
For real world sounds, it makes sense to set the reference value to the threshold of hearing which has been fixed as
at 1000 Hertz. So the range of human hearing covers about 12 Bel. Usually 1 Bel is divided into 10 decibel, so the common formula for measuring a sound intensity is:
sound intensity level (SIL) in decibel (dB) with
While the sound intensity level is useful in describing the way in which human hearing works, the measurement of sound is more closely related to the sound pressure deviations. Sound waves compress and expand the air particles and by this they increase and decrease the localized air pressure. These deviations are measured and transformed by a microphone. The question arises: what is the relationship between the sound pressure deviations and the sound intensity? The answer is: sound intensity changes are proportional to the square of the sound pressure changes
. As a formula:
Relation between Sound Intensity and Sound Pressure
Let us take an example to see what this means. The sound pressure at the threshold of hearing can be fixed at . This value is the reference value of the Sound Pressure Level (SPL). If we now have a value of
, the corresponding sound intensity relationship can be calculated as:
Therefore a factor of 10 in a pressure relationship yields a factor of 100 in the intensity relationship. In general, the dB scale for the pressure P related to the pressure P0 is:
Sound pressure level (SPL) in decibels (dB) with
Working with digital audio means working with amplitudes. Any audio file is a sequence of amplitudes. What you generate in Csound and write either to the DAC in realtime or to a sound file, are again nothing but a sequence of amplitudes. As amplitudes are directly related to the sound pressure deviations, all the relationships between sound intensity and sound pressure can be transferred to relationships between sound intensity and amplitudes:
Relationship between intensity and amplitudes
Decibel (dB) scale of amplitudes with any amplitude
related to another amplitude
If you drive an oscillator with an amplitude of 1, and another oscillator with an amplitude of 0.5 and you want to know the difference in dB, you can calculate this as follows:
The most useful thing to bear in mind is that when you double an amplitude this will provide a change of +6 dB, or when you have halve an amplitude this will provide a change in of -6 dB.
What is 0 dB?
As described in the last section, any dB scale - for intensities, pressures or amplitudes - is just a way to describe a relationship. To have any sort of quantitative measurement you will need to know the reference value referred to as "0 dB". For real world sounds, it makes sense to set this level to the threshold of hearing. This is done, as we saw, by setting the SIL to and the SPL to
.
When working with digital sound within a computer, this method for defining 0dB will not make any sense. The loudness of the sound produced in the computer will ultimately depend on the amplification and the speakers, and the amplitude level set in your audio editor or in Csound will only apply an additional, and not an absolute, sound level control. Nevertheless, there is a rational reference level for the amplitudes. In a digital system, there is a strict limit for the maximum number you can store as amplitude. This maximum possible level is normally used as the reference point for 0 dB.
Each program connects this maximum possible amplitude with a number. Usually it is '1' which is a good choice, because you know that everything above 1 is clipping, and you have a handy relation for lower values. But actually this value is nothing but a setting, and in Csound you are free to set it to any value you like via the 0dbfs opcode. Usually you should use this statement in the orchestra header:
0dbfs = 1
This means: "Set the level for zero dB as full scale to 1 as reference value." Note that for historical reasons the default value in Csound is not 1 but 32768. So you must have this 0dbfs=1 statement in your header if you want to use the amplitude convention used by most modern audio programming environments.
dB Scale Versus Linear Amplitude
Now we will consider some practical consequences of what we have discussed so far. One major point is that for achieving perceivably smooth changes across intensity levels you must not use a simple linear transition of the amplitudes, but a linear transition of the dB equivalent. The following example shows a linear rise of the amplitudes from 0 to 1, and then a linear rise of the dB's from -80 to 0 dB, both over 10 seconds.
EXAMPLE 01C01_db_vs_linear.csd
<CsoundSynthesizer>
<CsOptions>
-odac
</CsOptions>
<CsInstruments>
;example by joachim heintz
sr = 44100
ksmps = 32
nchnls = 2
0dbfs = 1

instr 1 ;linear amplitude rise
kamp      line    0, p3, 1     ;amp rise 0->1
asig      oscils  1, 1000, 0   ;1000 Hz sine
aout      =       asig * kamp
          outs    aout, aout
endin

instr 2 ;linear rise of dB
kdb       line    -80, p3, 0   ;dB rise -80 -> 0
asig      oscils  1, 1000, 0   ;1000 Hz sine
kamp      =       ampdb(kdb)   ;transformation db -> amp
aout      =       asig * kamp
          outs    aout, aout
endin

</CsInstruments>
<CsScore>
i 1 0 10
i 2 11 10
</CsScore>
</CsoundSynthesizer>
The first note, which employs a linear rise in amplitude, is perceived as rising quickly in intensity with the rate of increase slowing quickly. The second note, which employs a linear rise in decibels, is perceived as a more constant rise in intensity.
RMS Measurement
Sound intensity depends on many factors. One of the most important is the effective mean of the amplitudes in a certain time span. This is called the Root Mean Square (RMS) value. To calculate it, you have (1) to calculate the squared amplitudes of number N samples. Then you (2) divide the result by N to calculate the mean of it. Finally (3) take the square root.
Let us consider a simple example and then look how to derive rms values within Csound. Assuming we have a sine wave which consists of 16 samples, we get these amplitudes:
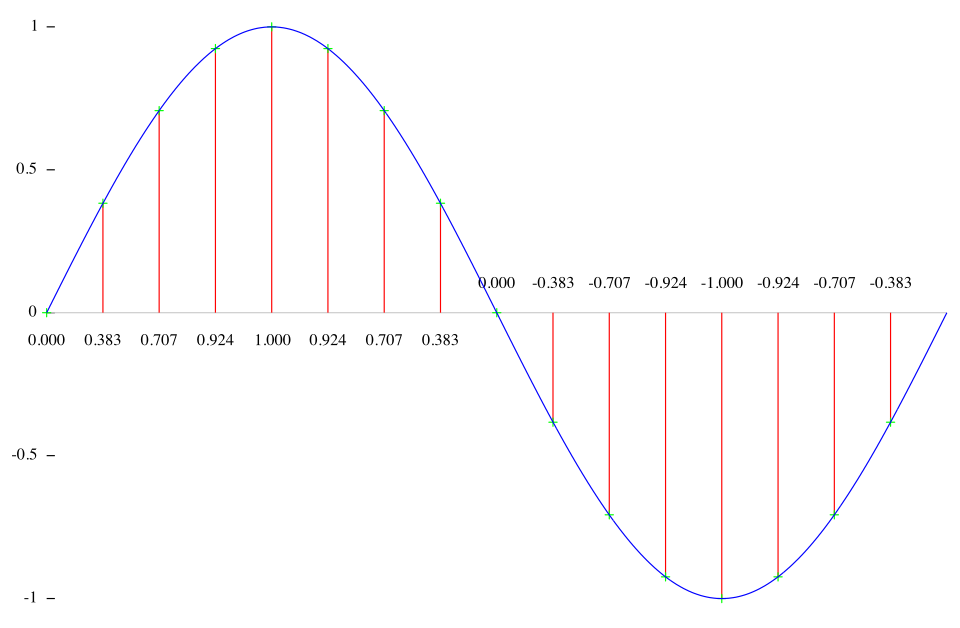
These are the squared amplitudes:
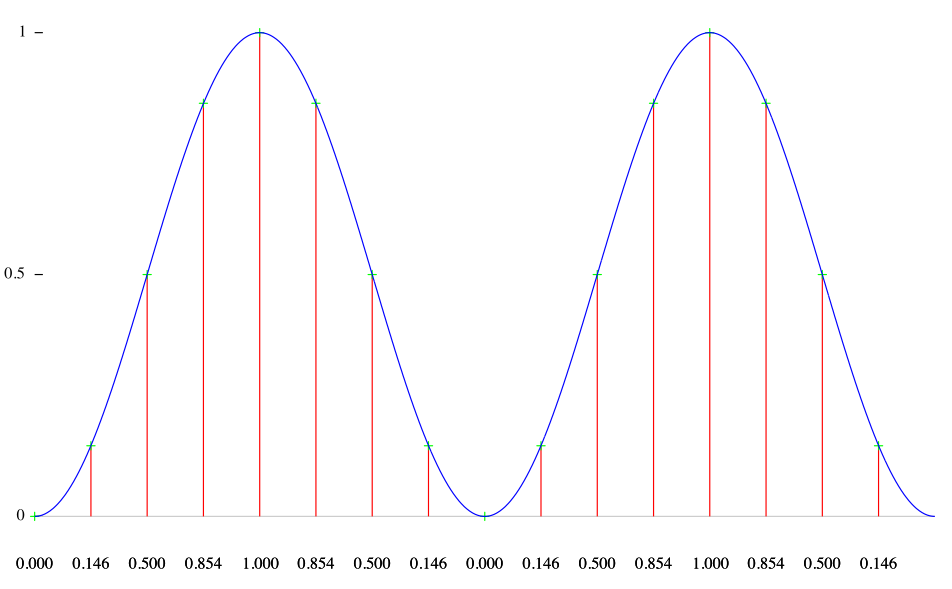
The mean of these values is:
(0+0.146+0.5+0.854+1+0.854+0.5+0.146+0+0.146+0.5+0.854+1+0.854+0.5+0.146)/16=8/16=0.5
And the resulting RMS value is sqrt(0.5) = 0.707 .
The rms opcode in Csound calculates the RMS power in a certain time span, and smoothes the values in time according to the ihp parameter: the higher this value is (the default is 10 Hz), the quicker this measurement will respond to changes, and vice versa. This opcode can be used to implement a self-regulating system, in which the rms opcode prevents the system from exploding. Each time the rms value exceeds a certain value, the amount of feedback is reduced. This is an example1 :
EXAMPLE 01C02_rms_feedback_system.csd
<CsoundSynthesizer>
<CsOptions>
-odac
</CsOptions>
<CsInstruments>
;example by Martin Neukom, adapted by Joachim Heintz
sr = 44100
ksmps = 32
nchnls = 2
0dbfs = 1

giSine    ftgen     0, 0, 2^10, 10, 1 ;table with a sine wave

instr 1
a3        init      0
kamp      linseg    0, 1.5, 0.2, 1.5, 0        ;envelope for initial input
asnd      poscil    kamp, 440, giSine          ;initial input
if p4 == 1 then                                ;choose between two sines ...
 adel1     poscil    0.0523, 0.023, giSine
 adel2     poscil    0.073, 0.023, giSine,.5
else                                           ;or a random movement for the delay lines
 adel1     randi     0.05, 0.1, 2
 adel2     randi     0.08, 0.2, 2
endif
a0        delayr    1                          ;delay line of 1 second
a1        deltapi   adel1 + 0.1                ;first reading
a2        deltapi   adel2 + 0.1                ;second reading
krms      rms       a3                         ;rms measurement
          delayw    asnd + exp(-krms) * a3     ;feedback depending on rms
a3        reson     -(a1+a2), 3000, 7000, 2    ;calculate a3
aout      linen     a1/3, 1, p3, 1             ;apply fade in and fade out
          outs      aout, aout
endin
</CsInstruments>
<CsScore>
i 1 0 60 1          ;two sine movements of delay with feedback
i 1 61 . 2          ;two random movements of delay with feedback
</CsScore>
</CsoundSynthesizer>
Fletcher-Munson Curves
The range of human hearing is roughly from 20 to 20000 Hz, but within this range, the hearing is not equally sensitive to intensity. The most sensitive region is around 3000 Hz. If a sound is operating in the upper or lower limits of this range, it will need greater intensity in order to be perceived as equally loud.
These curves of equal loudness are mostly called "Fletcher-Munson Curves" because of the paper of H. Fletcher and W. A. Munson in 1933. They look like this:
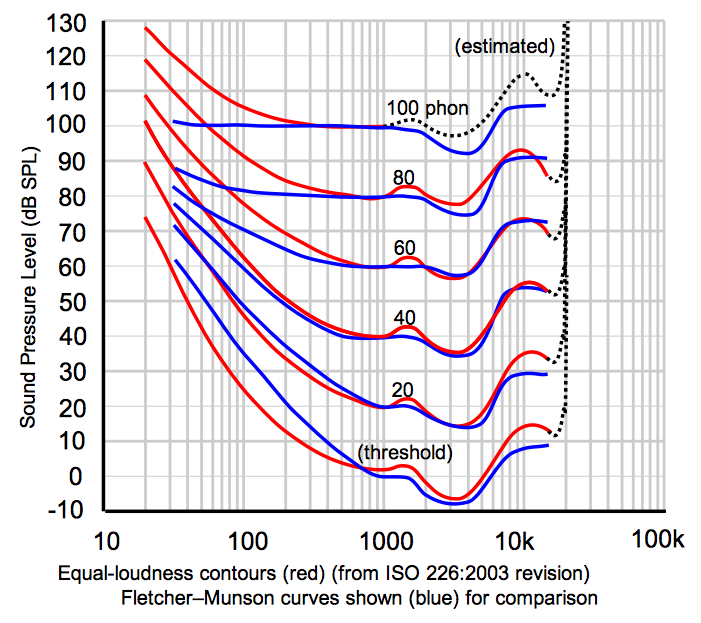
Try the following test. During the first 5 seconds you will hear a tone of 3000 Hz. Adjust the level of your amplifier to the lowest possible level at which you still can hear the tone. Next you hear a tone whose frequency starts at 20 Hertz and ends at 20000 Hertz, over 20 seconds. Try to move the fader or knob of your amplification exactly in a way that you still can hear anything, but as soft as possible. The movement of your fader should roughly be similar to the lowest Fletcher-Munson-Curve: starting relatively high, going down and down until 3000 Hertz, and then up again. Of course, this effectiveness of this test will also depend upon the quality of your speaker hardware. If your speakers do not provide adequate low frequency response, you will not hear anything in the bass region.
EXAMPLE 01C03_FletcherMunson.csd
<CsoundSynthesizer>
<CsOptions>
-odac
</CsOptions>
<CsInstruments>
sr = 44100
ksmps = 32
nchnls = 2
0dbfs = 1

giSine    ftgen     0, 0, 2^10, 10, 1 ;table with a sine wave

instr 1
kfreq     expseg    p4, p3, p5
          printk    1, kfreq ;prints the frequencies once a second
asin      poscil    .2, kfreq, giSine
aout      linen     asin, .01, p3, .01
          outs      aout, aout
endin
</CsInstruments>
<CsScore>
i 1 0 5 1000 1000
i 1 6 20 20  20000
</CsScore>
</CsoundSynthesizer>
It is very important to bear in mind when designing instruments that the perceived loudness of a sound will depend upon its frequency content. You must remain aware that projecting a 30 Hz sine at a certain amplitude will be perceived differently to a 3000 Hz sine at the same amplitude; the latter will sound much louder.
- cf Martin Neukom, Signale Systeme Klangsynthese, Zürich 2003, p. 383^