Python Scripting with Scribus
temp_graphing.py
This script is a modification of another that is depicted in the Scribus wiki in the page Advanced Graphing. That project came about after I wanted to make a script which depicted daily events that could occur at some specific time of day or night. I lumped these together in occurrences per hour of time.
From this I wanted to make something a little more flexibile, since in the original example the Y axis, the number of events, by definition were always zero or more, so the bottom of Y origin was always zero. I looked around trying to find some data which I could use to depict in a graph. Eventually, I deciding to accumulate my own data, based on hourly temperatures where I live. At the end of this chapter I explain how I did this in a semi-automatic fashion.
Conceptually what I needed to do in Scribus was to import the lines from the file, parse out the temperatures, create an appropriate graphical structure, then create the line that depicts these measurement. Along the way there needed to be some decision points about the graph to make sure the Y axis is appropriate for the data.
#!/usr/bin/env python
# -*- coding: utf-8 -*-

# File: temp_graphing.py
# creates graph with axes and plots Y values
# X values are fixed

import scribus, os, sys

xorigin = 80      # x-origin of graph
yorigin = 520     # y-origin of graph
xaxis=637         # x axis length
yaxis=408         # y axis length
color="Black"
colors = ''
linecolor = 'Black'
colorcount = 0
a = 1.5           # width of lines
l = 2.0           # width of plotted line
t = 0.8           # width of scale markers
xvalue = []
polyvalue = []
i=0
yvalue = []
yvalues = ''
time = ['00','01','02','03','04','05','06','07','08','09','10','11','12','13','14','15','16','17','18','19','20','21','22','23']
deg = u"\u00b0"   # unicode for degree sign

if scribus.haveDoc():
    tempfile = scribus.fileDialog('Select Your Data File','Text Files (*.txt)')
    for line in open(tempfile).xreadlines():
        content = line.split()
        yvalue.append(float(content[1]))
        yvalues = yvalues + content[1] + ' '
        i += 1
    colornames = scribus.getColorNames()
    for coloritem in colornames:
        colors = colors + coloritem + '   '
        colorcount += 1
        if (colorcount == 4):
            colorcount = 0
            colors = colors + '\n'
    linecolor = scribus.valueDialog('Enter a Line Color Name',colors,'Black')
    scribus.setRedraw(1)
    scribus.setUnit(0)
    xtick = xorigin
    xscale = xaxis/i    # this gives you typographic points per data unit
    yrange = float(scribus.valueDialog('Y Axis Maximum', 'Enter Top Value for Y Axis\n'+yvalues+'\n(Here is your data)'))
    ytick = yorigin
    yoffset = float(scribus.valueDialog('Y Axis Origin','Enter Y value of graph origin', '0'))
    yscale = float(yaxis/(yrange - yoffset)) # this gives you typographic points per data unit
    yCelscale = float(yscale * 9.0 / 5.0)    # typographic points per Celsius unit
    createaxes = scribus.valueDialog('Create Axes?','Do you want to create axes for this graph?\nChanging to anything else means No','Yes')
    nticks = 0
    while (nticks < i):
        xtick = xtick + xscale
        xlabel = xtick - 9.75
        xvalue.append(xtick)
        if (createaxes == 'Yes'):
            xt = scribus.createLine(xtick, yorigin, xtick, yorigin + 5) # creating X axis tick lines
            scribus.setLineWidth(t, xt)
            scribus.setLineColor(color, xt)
            scribus.setFillColor(color, xt)
            xbox = scribus.createText(xlabel, yorigin + 10, 20, 18)
            scribus.setText(time[nticks], xbox)
            scribus.setFont("DejaVu Sans Book", xbox)
            scribus.setFontSize(12, xbox)
            scribus.setTextAlignment(scribus.ALIGN_CENTERED, xbox)
            if (nticks == 0):   # only need to do these once
                d = scribus.createLine(xorigin,yorigin,xorigin+xaxis,yorigin) # create X axis
                scribus.setLineWidth(a, d)
                scribus.setLineColor(color, d)
                scribus.setFillColor(color, d)
                e = scribus.createLine(xorigin,yorigin,xorigin,yorigin-yaxis) # create Y axis
                scribus.setLineWidth(a, e)
                scribus.setLineColor(color, e)
                scribus.setFillColor(color, e)
                f = scribus.createLine(xorigin + 637,yorigin,xorigin + 637 ,yorigin-yaxis) # create secondary Y axis
                scribus.setLineWidth(a, f)
                scribus.setLineColor(color, f)
                scribus.setFillColor(color, f)
                ymark = int(scribus.valueDialog('Tick Mark Interval', 'Enter Y Interval for Tick Marks\n(Fahrenheit)', '10'))
                ytick = ytick - ymark * yscale
                while (ytick >= (yorigin - yaxis - 1)):
                    yt = scribus.createLine(xorigin, ytick, xorigin - 5, ytick) # creating Y axis tick lines
                    scribus.setLineWidth(t, yt)
                    scribus.setLineColor(color, yt)
                    scribus.setFillColor(color, yt)
                    ytick = ytick - ymark * yscale
                Celsorigin = float((yoffset - 32) * 5.0 / 9.0)
                firstCelstick = int(Celsorigin) + 1
                while 1:
                    if firstCelstick % 5 == 0:
                        break
                    else:
                        firstCelstick += 1
                yCentries = ''
                yCtickstart = yorigin - (float(firstCelstick - Celsorigin)) * yCelscale
                while yCtickstart > yorigin - yaxis:
                    yCentries = str(firstCelstick) + '\n\n' + yCentries

                    yC = scribus.createLine(xorigin + xaxis, yCtickstart, xorigin + xaxis + 5, yCtickstart)
                    yCtickstart = yCtickstart - 5.0 * yCelscale
                    firstCelstick += 5
                yentries = ''
                while yrange > yoffset:
                    yentries = yentries + str(int(yrange)) + '\n\n'
                    yrange = yrange - ymark
                ylabel = scribus.createText(xorigin - 40, yorigin - 412, 27.75, 415)
                scribus.setText(yentries, ylabel)
                scribus.setFont("DejaVu Sans Book", ylabel)
                scribus.setFontSize(12, ylabel)
                scribus.setTextAlignment(scribus.ALIGN_RIGHT, ylabel)
                yClabel = scribus.createText(xorigin + xaxis + 5, yorigin - 403, 21.75, 415)
                scribus.setText(yCentries, yClabel)
                scribus.setFont("DejaVu Sans Book", yClabel)
                scribus.setFontSize(12, yClabel)
                scribus.setTextAlignment(scribus.ALIGN_RIGHT, yClabel)
                flabel = scribus.createText(xorigin - 30, yorigin - 438, 30, 22)
                scribus.setText(deg + 'F', flabel)
                scribus.setFont("DejaVu Sans Condensed Bold", flabel)
                scribus.setFontSize(20, flabel)
                clabel = scribus.createText(xorigin + 633, yorigin - 438, 30, 22)
                scribus.setText(deg + 'C', clabel)
                scribus.setFont("DejaVu Sans Condensed Bold", clabel)
                scribus.setFontSize(20, clabel)
        nticks += 1

    item = 0
    while (item < i): # this interleaves the X and Y data for createPolyLine
        polyvalue.append(xvalue[item])
        polyvalue.append((yorigin + yscale * yoffset - yvalue[item] * yscale))
        item += 1
    poly = scribus.createPolyLine(polyvalue) # this is the actual plotting
    scribus.setLineWidth(l, poly)
    scribus.setLineColor(linecolor, poly)
    scribus.setFillColor("None",poly)
    scribus.selectObject(poly)
else:
    if scribus.newDocument(scribus.PAPER_LETTER, (20,20,20,20), scribus.LANDSCAPE, 1, scribus.UNIT_POINTS, scribus.PAGE_1, 0, 1):
        scribus.messageBox('Message', 'You did not have a document open, so \none has been created for you.\n\nNow you can run the script again.', scribus.ICON_NONE, scribus.BUTTON_OK)
scribus.redrawAll()
At the beginning, a number of variables are initialized, with the X, Y origin and length of the axes hardcoded. Every element of the graph is referenced to the variables xorigin and yorigin. Because of this, the placement of the graph on the page can be adjusted by changing these values and nothing else. The script is designed to work with a US Letter page in landscape orientation, but actually could be used with A4 paper by just adjusting these two variables.
Something I have done here is to allow for the user to have already created a document with if scribus.haveDoc():, but if not, the alternative else: clause creates one, even though the script then ends and must be started again. This ends up being more convenient than just ending the script and having the user manually create a new document.
Next, using fileDialog(), the user must choose a file, an individual line of which looks like this:
Temperature: 60.1 F (15.6 C) Tue Mar 6 14:01:18 EST 2018
The split method works well here, dividing this line according to where spaces are. The second string, the Fahrenheit temperature, is what we're wanting, obtained with content[1], remembering that the first, content[0] would be Temperature:. I don't really need the date or time, since individual files cover a 24-hour period, with hour 00 the first line and hour 23 the last line.
Since you have a choice as to the color of the graph line, we need to get a list of colors available from Scribus, then ask the user which to choose, with a default of Black. The next step is for the user to decide what the top value of the Y axis should be, and in the valueDialog() he is shown all the data imported from the file. Then, one chooses the value for the Y origin, which might be something other than zero, like 20 or even -10. With these maximum and minimum data values for the Y axis, a scaling factor, yscale, can then be calculated. There should always be 24 data points, so the X axis scaling factor, xscale,needs no user input.
The next valueDialog() wants to know if axes should be created. If you have already created a graph and just want to make another graph line on it, then change the default Yes to anything else. I like this method since not only is coding easier, but user input is easier as well. The last place for user input comes after we've begun making the axes and tick marks. If you have chosen not to create axes, then this fileDialog() is skipped, along with all the other axes and tick-creating code.
At long last, we graph the data with this relatively small part of the script:
    item = 0
    while (item < i): # this interleaves the X and Y data for createPolyLine
        polyvalue.append(xvalue[item])
        polyvalue.append((yorigin + yscale * yoffset - yvalue[item] * yscale))
        item += 1
    poly = scribus.createPolyLine(polyvalue) # this is the actual plotting
    scribus.setLineWidth(l, poly)
    scribus.setLineColor(linecolor, poly)
    scribus.setFillColor("None",poly)
    scribus.selectObject(poly)
The hardest part to get right is the calculation of the Y-Pos values, particularly considering that higher data values translate to smaller Y-Pos values, since a Y-Pos of zero is the top of the page.
Here is an even trickier task:
                Celsorigin = float((yoffset - 32) * 5.0 / 9.0)
                firstCelstick = int(Celsorigin) + 1
                while 1:
                    if firstCelstick % 5 == 0:
                        break
                    else:
                        firstCelstick += 1
                yCentries = ''
                yCtickstart = yorigin - (float(firstCelstick - Celsorigin)) * yCelscale
                while (yCtickstart > yorigin - yaxis):
                    yCentries = str(firstCelstick) + '\n\n' + yCentries

                    yC = scribus.createLine(xorigin + xaxis, yCtickstart, xorigin + xaxis + 5, yCtickstart)
                    yCtickstart = yCtickstart - 5.0 * yCelscale
                    firstCelstick += 5
When this script was originally written, it only made a left Y axis and ticks for Fahrenheit values, but I wanted to also create marks for Celsius. The problem starts with figuring out what the value of the bottom tick should be and where it should be. I start out by taking the Fahrenheit value of the Y origin and converting to Celsius, very likely to be an odd decimal value. I truncate this with int, chopping off the decimal, then add 1. Next I need to find the next value divisible by 5, since I decided to space the Celsius ticks every 5 degrees Celsius. Once I have this first tick, then placing the rest is fairly straightforward.
With a few more embellishments, like scales and labels, we get something like this as the result:
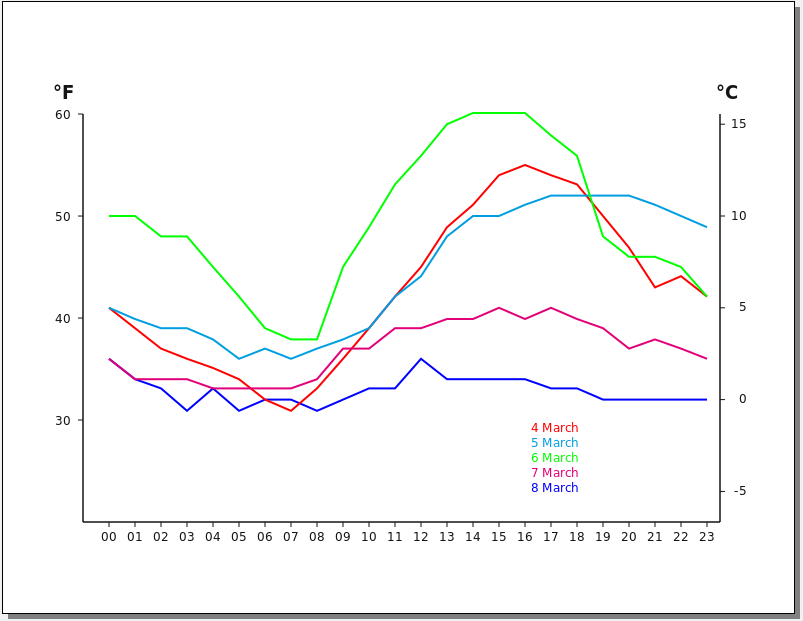
Here I show 5 consecutive days of data, and the reason for color choices becomes obvious. With the way the script works, I can even save this document, open it, then run some time later to add more data, as long as I pay attention to the limits of the Y axis, 60 and 20 in this case, since these will need to be entered as the script runs. Any additional labels, such as a title for the graph or a key to indicate which color corresponds to a particular date, would be manual operations in Scribus, and I don't see a reason to add these to the script. As you can see, I have added a text frame and put in a key for the different graph line colors. Something else which is a manual operation is the adjustment of the linespacing for the Fahrenheit and Celsius scales. The easiest way to do this is to first make sure the top values is lined up with the topmost tick (by moving the frame as needed), then adjust the linespacing with the mouse wheel – remember if you hold down Shift while scrolling, the changes in the spinbox are by tenths of a point.
Some limitations
Something that doesn't work well is if you might, for example, set the value of the Y origin to 25, and the tick interval to 10. The ticks probably come out alright, but the markers should say 55, 45, 35... and they will instead be 60, 50, 40... If you have to extend your Y axis because new data would be off the chart, you are probably better off starting all over rather than trying to edit the graph, then run the script only with the new data. It might be tempting to make a new page, then copy and paste the polylines with careful shrinkage vertically to match up to the new scale.
Because of the automated way that the X axis works, you couldn't run this where there were gaps in the data, but what you could do in that case would be to add lines to the data file where there is a gap, then in Scribus afterward edit the polyline shape to snip out the artificial data, then move the accurate parts horizontally if needed.
Making the data file
I suppose it's possible to find historical weather data somewhere, but I thought it would be more interesting to do this with a cron task. I have a command line program called weather (the latest version is weather-2.3). Once I had this downloaded, unzipped and untarred, I can go to its directory and type something like:
./weather "Louisville East CCD"
and the output looks like this:
Searching via name...
[using result Louisville East CCD, KY]
Current conditions at Bowman Field, KY
Last updated Mar 07, 2018 - 10:53 AM EST / 2018.03.07 1553 UTC
   Temperature: 39.0 F (3.9 C)
   Relative Humidity: 59%
   Wind: from the NW (320 degrees) at 10 MPH (9 KT) gusting to 26 MPH (23 KT)
   Sky conditions: overcast
This led then to the following shell script (notice the pipe to the grep command):
#! /usr/bin/env sh
# weather.sh - created to be a cron job

cd /home/gregp/Downloads/weather-2.3
./weather "Louisville East CCD" | grep Temperature >> /home/gregp/temp.txt
'date' >> /home/gregp/temp.txt
and its output looks like this, which is appended to a file temp.txt:
   Temperature: 39.0 F (3.9 C)
Wed Mar  7 11:32:03 EST 2018
Notice that I did not try to grep out the date and time, but simply used the shell command date. I then placed an executable copy of this shell script in /etc/cron.hourly in one of my computers that is always running and connected to the internet. As long as that computer is on, it accumulates these readings hourly. The last steps to make this usable by the script is to open the temp.txt file into Kwrite, so that I can do a Replace using regex to convert '\)\n' to '\) ', converting each newline character after the closing parentheses to a space, so now each line looks like this:
Temperature: 39.0 F (3.9 C) Wed Mar 7 11:32:03
which is parsable by my script. The last step is to make an individual file of 24 lines for each date's data, and this is the file I look for with the fileDialog().
Note: you can obtain weather from http://fungi.yuggoth.org/weather/src/