Python Scripting with Scribus
piechart.py
Although I haven't used this script as often as I thought I would, if nothing else this represents another proof of concept sort of project. The idea was to use Scripter to create a pie chart by entering the data on the fly. At the time, there was no built-in way to do this with Scripter all by itself, but after playing around with SVGs I realized that one could create an SVG file using Python which could then be imported into Scribus.
#!/usr/bin/env python
# File piechart.py
# Automatically creates a piechart SVG file
# from a list of data
##########################################

import math
import scribus
# We'll create a list L, append to it, then copy the list to a file at the end
L = ['<?xml version="1.0" encoding="UTF-8" standalone="no"?>\n']
L.append('<!DOCTYPE svg PUBLIC "-//W3C//DTD SVG 1.1//EN"\n')
L.append('"http://www.w3.org/Graphics/SVG/1.1/DTD/svg11.dtd">\n')
L.append('<svg width="20cm" height="20cm" xmlns="http://www.w3.org/2000/svg" version="1.1">\n')
svgfile = scribus.valueDialog('SVG File','Enter name of file to save to\n".svg" will be appended')
svgfile = svgfile + '.svg'

nvalues = []
newvalues = scribus.valueDialog('Data Entry','Enter Data Values, separated by spaces')

nvalues = map(float, newvalues.split())
i = 0
total = 0
i = 0
seg = 0
radius = 150
startx = 200
starty = 200
lastx = radius
lasty = 0
ykey = 40
colors = ['red','blue','yellow','magenta','green','slateblue','slategrey','greenyellow','wheat', 'violet']
bordercolor = 'black'
for n in nvalues:
    total = total + n

for n in nvalues:
    arc = "0"
    seg = n/total * 360 + seg
    if ((n/total * 360) > 180):
        arc = "1"
    radseg = math.radians(seg)
    nextx = int(math.cos(radseg) * radius)
    nexty = int(math.sin(radseg) * radius)

    L.append('<path d="M '+str(startx)+','+str(starty) + ' l '+str(lastx)+','+str(-(lasty))+' a150,150 0 ' + arc + ',0 '+str(nextx - lastx)+','+str(-(nexty - lasty))+ ' z" \n')
    L.append('fill="'+colors[i]+'" stroke="' + bordercolor + '" stroke-width="0.5" stroke-linejoin="round" />\n')
    L.append('<rect x="375" y="'+ str(ykey) + '" width="40" height="30" fill="'+colors[i] + '" stroke="black" stroke-width="0.5"/>\n')
    ykey = ykey + 35
    lastx = nextx
    lasty = nexty
    i += 1
L.append('</svg>')
output = open(svgfile,'w')
output.writelines(L)
output.close()
endmessage = svgfile + ' was created'
scribus.messageBox("Finished",endmessage,icon=scribus.ICON_NONE,button1=scribus.BUTTON_OK)

if scribus.haveDoc():
    scribus.placeSVG(svgfile, 100, 100)
    Totalframe = scribus.createText(340, 300, 100, 50)
    scribus.insertText("Total = " + str(total), 0, Totalframe)
If you go through this script, you will realize that we only use Scripter for the dialogs to get the filename to save the SVG to, the data points, and at the end for a messageBox() and for an informational text frame. I can easily imagine this could be modified to use from the command line, and perhaps view the SVG in Inkscape.
As we begin the script we create a list L, which consists of the lines of the SVG file we are going to save. Once we create the preamble, we then ask for a filename, and also save the user from having to add the .svg extension. Next we ask the user to enter all the values for the segments of our chart, separated by spaces. We then use the map function to convert all of these to float values as we split() the string.
Subsequently, you can see that we have hardcoded the size and starting point of our pie chart, create a list of colors to use (and if there are more than 10 segments to the chart, we're in trouble). Because the math works out easier, I decided to start the first segment of the pie chart as a horizontal ray to the right of the center, after which we create right-sized arcs counterclockwise around the circle. The language you see here is how to create pie segments with SVG notation. Once we go through the data, we save the file.
One of the important bits of information about a pie chart is that you want to know the size of the whole data set, so this is why we create this text frame at the end. After the script runs, loading the SVG into Scribus is a manual operation, and of course you can then edit its overall size, placement on the page and even the colors quite easily. Something to be aware of in that regard is that this SVG will actually be a group of objects, so you have to Ungroup to be able to edit colors, borders, and even positioning of individual segments.
If you check the Scribus wiki at https://wiki.scribus.net/canvas/Making_a_Pie_Chart you will see a more detailed explanation of the math, and also an added feature, simultaneously creating a key to the side of the pie chart so that segments can be labeled easily. Here is an example of a completed piechart:
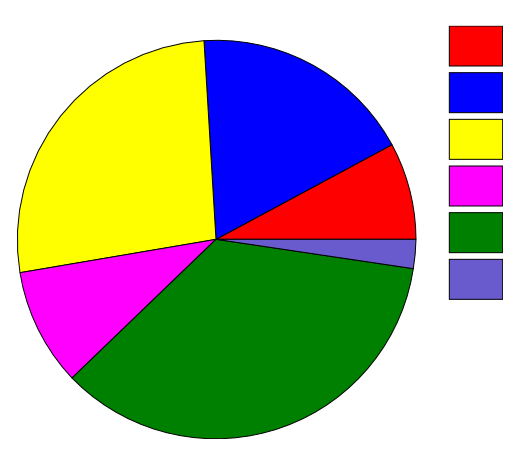
This piechart was created with a version of the script that also adds these rectangles on the side, to be used as a key with accompanying text to explain what each segment represents.