KDE
Reading backtraces
A backtrace (also called a stack trace or stack traceback) is a report of how the program has called different functions as it goes along. It is commonly used during interactive and post-mortem debugging. It can also be displayed to the user of a program as part of an error message, which a user can report to a programmer.
Each function puts a stack frame on the stack containing its arguments and other information it needs to run. The active stack frames reflect a certain point in time during the execution of a program. A stack trace allows you to track the sequence of nested functions called up to the point where the stack trace is generated. In a post-mortem scenario, the stack trace goes up to, and includes, the function where the failure occurred. Be aware, however, that the function where the failure occurred might not be responsible for the failure; an error could well have been embedded in a higher function (for instance, by passing an incorrect value to the function where the program failed).
The following figure illustrates a stack frame, where main() called hello(), which called hi(), which called readinput(). A stack trace is likely to work down from the last call to the first, so that readinput() might appear first.
.png)
Backtraces are essential. They may look meaningless to you, but they might actually contain a wealth of useful information. A backtrace describes which functions were called prior to the crash, so that developers may track down in which function the mess started. Exact memory addresses can also help locate problematic data, such as in a core dump (a file left behind when a program fails, containing the contents of live memory at the time of the failure). But producing good backtraces has a downside: libraries and executables occupy much more disk space than their optimized counter parts that can't provide the information to produce a backtrace.
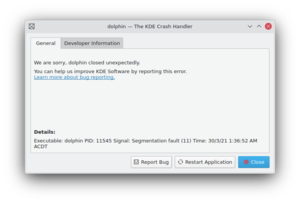
The KDE Crash Dialog (Dr. Konqi) should appear right after a crash.
Opening the "Developer Information" tab will display the relevant backtrace. This process may take some time and a lot of memory, so things may go sluggish all of a sudden. But the result should look something like this:
Using host libthread_db library "/lib/libthread_db.so.1".
[Thread debugging using libthread_db enabled]
[New Thread -1232783168 (LWP 7604)]
[KCrash handler]
#6  0x0806be76 in TreeMapItem::parent (this=0x0)
    at /home/bram/KDE/kde3/kdeaddons/konq-plugins/fsview/treemap.h:285
#7  0x08065fea in TreeMapItemList::compareItems (this=0xbfec04a8, item1=0x0,
    item2=0x0)
    at /home/bram/KDE/kde3/kdeaddons/konq-plugins/fsview/treemap.cpp:720
#8  0xb7281619 in QGList::operator== () from /usr/qt/3/lib/libqt-mt.so.3
#9  0x0806d498 in QPtrList<TreeMapItem>::operator== (this=0xbfec04a8,
    list=@0xbfec0468) at /usr/qt/3/include/qptrlist.h:74
#10 0x08062e18 in TreeMapWidget::mousePressEvent (this=0xbfec03ac,
    e=0xbfebff1c)
    at /home/bram/KDE/kde3/kdeaddons/konq-plugins/fsview/treemap.cpp:1840
#11 0xb7004a63 in QWidget::event () from /usr/qt/3/lib/libqt-mt.so.3
#12 0xb6f6bca7 in QApplication::internalNotify ()
   from /usr/qt/3/lib/libqt-mt.so.3
#13 0xb6f6ca88 in QApplication::notify () from /usr/qt/3/lib/libqt-mt.so.3
#14 0xb7725a84 in KApplication::notify (this=0xbfec055c, receiver=0xbfec03ac,
    event=0xbfebff1c)
    at /home/bram/KDE/kde3/kdelibs/kdecore/kapplication.cpp:550
#15 0xb6f0bfd2 in QETWidget::translateMouseEvent ()
   from /usr/qt/3/lib/libqt-mt.so.3
#16 0xb6f0b8b0 in QApplication::x11ProcessEvent ()
   from /usr/qt/3/lib/libqt-mt.so.3
#17 0xb6f1b761 in QEventLoop::processEvents () from /usr/qt/3/lib/libqt-mt.so.3
#18 0xb6f82831 in QEventLoop::enterLoop () from /usr/qt/3/lib/libqt-mt.so.3
#19 0xb6f826b6 in QEventLoop::exec () from /usr/qt/3/lib/libqt-mt.so.3
#20 0xb6f6b72f in QApplication::exec () from /usr/qt/3/lib/libqt-mt.so.3
#21 0x0805181e in main (argc=134673960, argv=0xffffffff)
    at /home/bram/KDE/kde3/kdeaddons/konq-plugins/fsview/main.cpp:55
In this backtrace, the first stack frame is shown on line #6. Because the stack is unwound from the end back to the beginning, we can see that the call that crashed the program was parent(), which was called by compareItems() on line #7, which in turn was called by the overloaded == operator on line #8, and so on.
After the line number, the hexadecimal number starting each line is the address in memory where the stack frame starts for each function. Unless you have a core dump, this is not useful to you. More interesting are the lists of arguments and the addresses of their data in parentheses. Thus , line #6 shows that parent() was called with a single argument, this, whose value was 0 (0x0 in hex). Of course, the name this is assigned to the object on which the method was invoked. So the parent() method was actually called without arguments. Methods in object-oriented languages are passed the pointer to the object on which they were invoked as their first argument. So compareItems() on line #7 was called with two arguments, but because this was passed as the first argument, three are shown in parentheses.
On line #6, the string "(this=0x0)" indicates that the parent() function is being called with a NULL pointer. Of course, any program will crash if it tries to retrieve data from, or put data into, an address to which it doesn't have access. The address 0x0 on virtually every computer system is reserved and unavailable to the program, so you can tell that reading from or writing to a NULL pointer will cause a crash. You can also see, in the documentation for the Qt function parent(), that it is called without arguments (so the problem was not caused by a bad argument) and returns a pointer to the parent of the object on which it is called. Therefore, the developer should try to figure out what object parent() was called on and why the parent could not be returned.
